
Performance is always crucial. Fortunately, there's Google Chrome Lighthouse!
Innerworks is coming soon...
This blog was originally published on our previous Cogworks blog page. The Cogworks Blog is in the process of evolving into Innerworks, our new community-driven tech blog. With Innerworks, we aim to provide a space for collaboration, knowledge-sharing, and connection within the wider tech community. Watch this space for Innerworks updates, but don't worry - you'll still be able to access content from the original Cogworks Blog if you want.
Performance matters.
We’ve spoken a lot so far on why performance matters lately (just a quick walk around our blog and socials means your likely to bump into all the reasons as to why “#perfmatters”. As you’re here, I’m guessing it matters to you too :)
Lighthouse for website performance.
This blog will take you through how to use your Google Chrome Lighthouse report to ultimately improve your own project’s performance! I will share my top tips, tools and tricks (for developers and technical wizards) on how to keep your pages light and fast. Something we all know to be crucial in a world where the majority of us are browsing on mobile devices.
What is Lighthouse?
Google describes Lighthouse as an ‘open-source, automated tool for improving the quality of web pages’. In other words, Lighthouse will check your website for improvements that can be made in performance, SEO, accessibility and best practices. The tool will give you a score that is a great indicator of how to improve your page and why it’s important to do so.
This must-have tool, created by Google is available to run from our most famous internet browser, Google Chrome (available in Chrome DevTools). For those who don’t use Chrome, don’t worry. Lighthouse is also available as an extension on other browsers, as a web tool or as an npm module.
How to get your performance audit.
You may already have your way to generate a lighthouse report. Here, I’m going in via the built-in Chrome DevTools option from the Chrome browser.
Once the audit is complete, you’ll see a page like the one below.
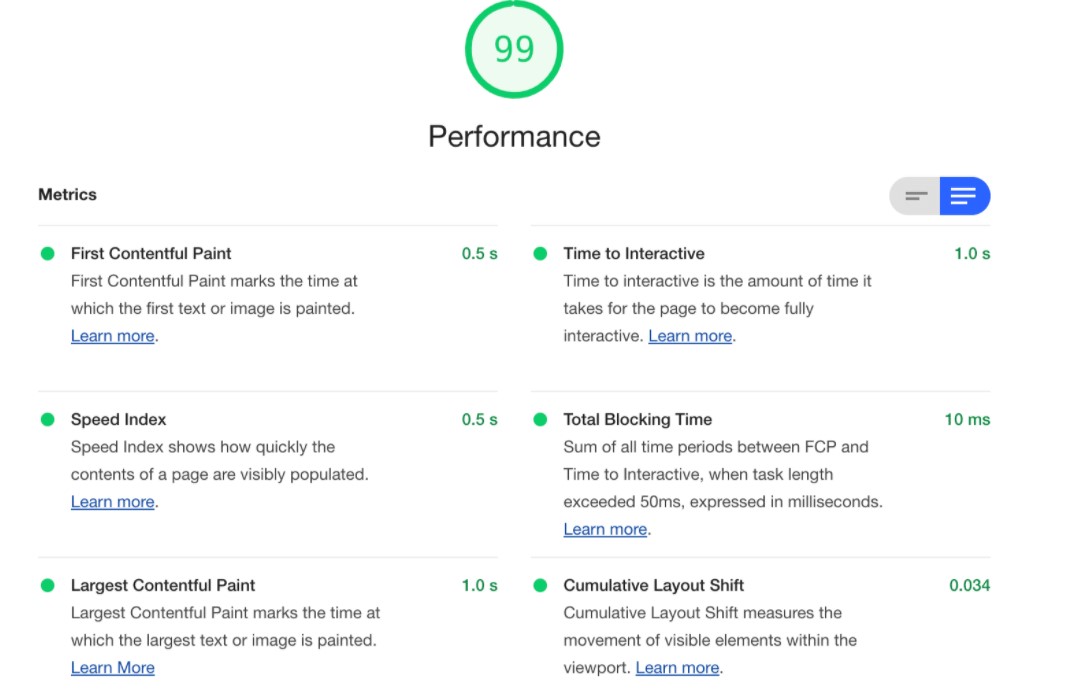
What does this report tell me?
A website performance audit covers various examined aspects of the website's work. The good news is that there is a way to leverage your score on all six elements of this performance report using specific tools and tips to increase your overall score.
All of these elements have different weights in counting final scores for the audit. The table below shows the particular weight for each audit.
Metric | Weight |
FCP (First Contentful Paint) | 15% |
SI (Speed Index) | 15% |
LCP (Largest Contentful Paint) | 25% |
TTI (Time to Interactive) | 15% |
TBT (Total Blocking Time) | 25% |
CLS (Cumulative Layout Shift) | 5% |
If you want to maximise your score there is a great tool at the ready. Lighthouse Scoring Calculator can work out the metrics you need to hit to reach a particular score. So, if your goal is to reach 99, this app will tell you how fast specific aspects will need to load or work to achieve this.
Reading the report.
I recommend reading Critical Rendering Path (fundamental knowledge for front-end developers and a hot topic in job interviews) with a combination of other resources from sites like WebDev to better understand how to initially read your Lighthouse performance report. But I won’t dive too deep in how to read them in this blog, let’s get into the tools and tips on how to make improvements.
Styles
It’s important to keep your CSS clean and light (especially if we use any 3rd party libraries or frameworks like Bootstrap or Tailwind). First Contentful Paint is one of the most important metrics in the performance audit. It marks the first point in the page load timeline where the user can see anything on the screen so it's worth avoiding heavy animations here and considering inline styles for this part of the page.
There are three awesome tools that will jazz up our stylesheets:
- Stylelint - I always recommend to use linters everywhere where it’s possible. For styles, foravaScript, for Git commits. They will help you to keep your code clean and free of bugs and typos.
- PurgeCSS - This is another tool that does great work. It’s super useful when you use Bootstrap, Tailwind or any other library in your projects. PurgeCSS automatically removes all unused CSS classes from your CSS codebase (and sometimes works miracles with the final bundle size).
- CSS Nano - This will optimize and compress your CSS to ensure that the final result is as small as possible for a production environment.
Images
I believe that oversized images are the most common issue that appears in Lighthouse Performance reports. Here are some key things you should always remember:
- Try to always serve your images in the actual size they are rendered on the page.
-Try to avoid scaling them in CSS. You could waste a lot of loading time when you load large photos for tiny avatar pics etc.
- Use proper file types. If possible, use modern web formats, such like webP.
- Use CDN (Content Delivery Network) to serve your images and static files where possible.
- Webpack with url-loader allows you to inject images directly into markup as base64 strings. You can set a file size limit behind which it will work. You can save a lot of time on decreasing the number of requests to the server so it’s well worth using it.
Fonts
Custom web fonts kill performance. I could stop here, but I know it’s hard to avoid using custom fonts as most websites nowadays use them. To save some time, you can serve web fonts from the same origin as the web site itself to eliminate the TLS negotiation time. It’s worth mentioning about FOIT (Flash of Invisible Text). This is when a browser renders invisible text until the font loads! It's a good idea to get your text rendering under control with the front-display CSS property.
JavaScript
This may be at the end of the list, but that doesn’t make it less important! JavaScript is actually one of the most important elements to take care of in terms of modern web performance. I will give you a few key tips:
- If you can, split your code into smaller chunks and load on the current page only those that are required. Code splitting is one of the most compelling features of Webpack and if it’s used correctly, can have a major impact on load time.
- Compression - If you use Webpack, you don’t need to worry too much about compression as Webpack automatically minimizes the bundled JavaScript code for production.
- Remove Render-Blocking JavaScript. You can use the defer attribute on your script tags to achieve this. The defer attribute tells the browser not to wait for the script and the script just loads “in the background”.
- Use Web Workers when you need to execute code that needs a lot of execution time. Web Workers allow script operation in a background thread separate from the main execution thread of a web application and you can avoid blocking the user interface thread this way.
Thanks for reading!
I hope that you found something valuable here. Good luck with optimizing your apps. And remember, Lighthouse is a super useful tool, but it doesn’t mean that you have to fight for every single point in your audit score.
For extra performance-related reading, why not check out our blog on how to leverage your performance testing skills to sky-rocket website performance? If you’re a user of the Umbraco CMS, our CTO’s talk on how to get peak performance using automated techniques.